How to master risk-to-reward ratio in forex
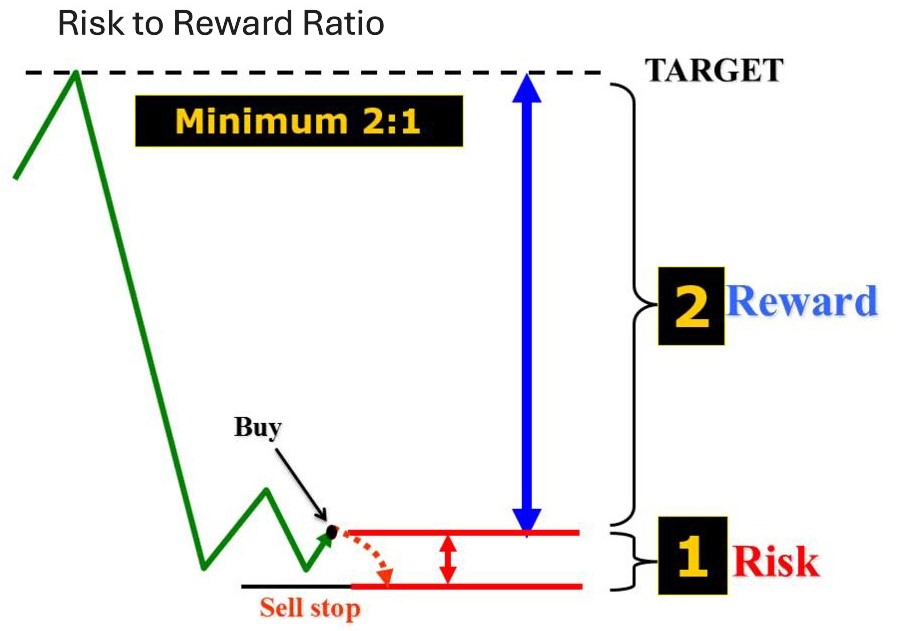
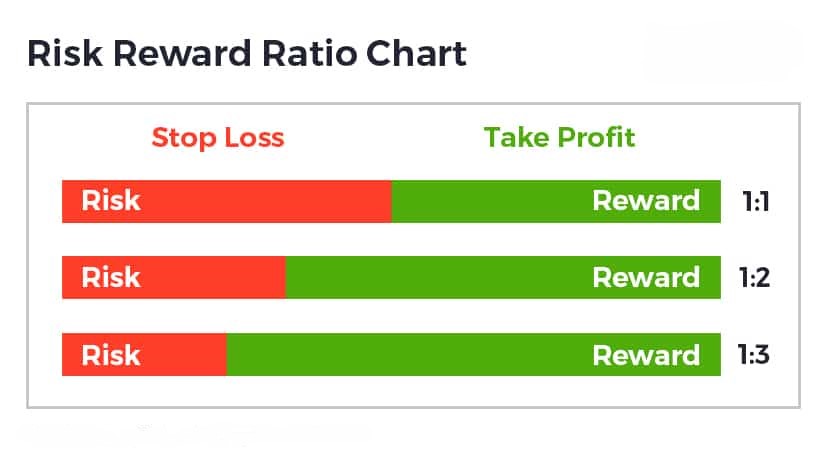
The risk-to-reward ratio functions as an essential tool which traders need to use for assessing trading possibilities before investing their funds. The ratio demonstrates trading risk exposure through its measurement of potential losses against possible gains. The R:R ratio stands at 1:2 when the target profit reaches 100 pips while the potential loss amounts to 50 pips. The basic calculation enables traders to identify market situations which provide better profit potential than possible losses.
A risk-to-reward plan with proper structure needs more than one trading operation to function. Over time, it determines whether a trading strategy is sustainable. A small number of successful outcomes can generate profits when the total rewards from successful bets exceed the total risks taken. A trader who wins 40% of their trades can still generate profits through the right trade design which includes a 1:3 risk-to-reward ratio.
What the risk-to-reward ratio measures
A trading transaction produces a risk-to-reward ratio that demonstrates the relationship between possible losses and anticipated gains from a single deal. The process begins with two essential elements which are risk and reward. Risk equals the difference between the entry price and stop-loss level but reward equals the distance from entry price to take-profit level. Both are typically measured in pips.
The EUR/USD pair is set to trade at 1.0800 with stop-loss at 1.0780 and target at 1.0840. The risk is 20 pips, and the reward is 40 pips. The reward-to-risk ratio equals 2:1 because we obtain the reward-to-risk ratio by dividing the reward by the risk. This means that for every pip risked, the trade has the potential to make two.
The ratio requires modification to include transaction costs which encompass spreads and commissions for complete understanding. The spread of 2 pips on EUR/USD reduces the effective reward to 38 pips from the original 40 pips. The modification makes the calculation show the actual net profit potential.
The math linking R:R and win rate
Risk-to-reward ratios function as independent factors which do not establish profitability on their own. The missing element in this strategy is win rate which represents the proportion of profitable trades out of total trades. The two elements create expectancy which shows the average profit or loss amount traders can expect from their trades.
The expectancy formula requires you to multiply your win rate by your average win amount and then subtract the product of your loss rate and average loss amount.
A trader achieves success in 40% of their trades by earning 60 pips per win but experiences losses in 60% of trades with 30 pips at risk. Plugging into the formula:
(0.40 × 60) − (0.60 × 30) = 24 − 18 = +6 pips.
The trading system demonstrates a 6 pip positive expectation for each trade when analyzed through long-term data. The win rate remains under 50% but the bigger average reward makes the system profitable. A trader who wins 70% of their trades but uses a 1:0.5 risk-to-reward ratio will end up with negative expectancy when transaction fees are included in their trading results.
Setups that define R:R before execution
A risk-to-reward ratio becomes useful only when traders establish their stop-loss and take-profit levels before starting a trade. A stop-loss determines the highest amount of loss a trader wants to experience before exiting a trade and a take-profit defines the desired profit level. The evaluation system needs to use particular assessment standards instead of using arbitrary numerical scores.
The most popular method used for protein structure prediction is structure-based placement. The stop-loss should be placed just below the recent support level while the target should be set at the following resistance level. The Average True Range (ATR) serves as a volatility indicator for this method. The EUR/USD ATR value of 30 pips allows traders to set stop-loss at 1×ATR and target at 2×ATR which maintains a 1:2 risk-reward ratio that follows market volatility.
Let’s say a trade is planned on GBP/USD at 1.2700 with a stop 25 pips away and a target 50 pips higher. The system produces a 1:2 risk to reward ratio which allows users to gain double their investment for each risk they take. The trader sets these parameters before trading to reduce emotional influence while following established rules instead of making spontaneous choices.
Converting R:R into account risk
The establishment of stop-loss and take-profit levels provides order to trading but position sizing controls the amount of capital that remains vulnerable during market fluctuations. Theoretical trading risk-to-reward ratios link to account balance through position sizing which protects accounts from major losses by controlling individual trade sizes. A widely used guideline is to risk only 1–2% of account equity on any trade.
A trader maintains 10,000 USD in their trading account while establishing a risk level of 1% based on their total account balance. That amounts to 100 USD. The maximum value per pip for EUR/USD stop-loss at 50 pips should be 2 USD (100 ÷ 50). In practical terms, this means opening a position size of 0.2 lots, since in standard forex contracts 1 lot typically equals 10 USD per pip.
The same principle applies to all trading accounts regardless of their size and currency pair selection. The first step of calculation requires dividing equity percentage by risk to find stop-loss pips before determining position size. The system maintains all trading activities within predetermined risk boundaries.
Making R:R realistic
The theoretical risk-to-reward ratio of a trade shows promise but market conditions in reality tend to minimize the gap between predicted and achieved results. The net reward from trading becomes lower because of transaction costs which include spreads and commissions and slippage occurs during market volatility to make trading riskier. The actual reward amount becomes 47 pips when spreads and commissions subtract 3 pips from the initial 50 pips profit target. The various characteristics between these trades produce a sequence of effects which lead to changes in total profitability.
The total cost of borrowing money is affected by financing charges which are also known as swaps or rollover fees. The overnight position may result in additional expenses or minimal interest rate-based credits which depend on market conditions. The charges impact long-term trading more than short-term trading but need to be considered for net return calculations.
The implementation of leverage introduces new operational difficulties to the system. The system allows investors to control larger trading positions through reduced margin requirements which leads to higher profits and greater potential losses. The 50:1 leverage ratio on a 10,000 USD account allows traders to manage positions worth 500,000 USD which results in substantial equity changes from minimal price movements. The cost calculation process enables traders to determine their risk-to-reward ratio which reflects the true market conditions of trading.
Stress-testing your target R:R
A risk-to-reward ratio only proves its value when tested over a large number of trades. Backtesting is the first step, where historical price data is used to simulate how a strategy with a defined R:R would have performed. The testing of a 1:2 risk ratio requires 200 past EUR/USD trades to determine if the setup generates reliable results or causes excessive drawdowns. Forward-testing involves using real-time market rules on a demo account to verify system performance under actual market conditions which is also known as paper trading.
Multiple performance metrics exist to deliver information that goes past basic win–loss statistics. The profit factor indicates the relationship between winners and losers through its calculation of gross profit divided by gross loss. Maximum drawdown shows the biggest decline between peak and trough values which reveals the extent of extended losing periods. The recovery factor demonstrates strategy effectiveness at recovering losses through the calculation of total net profit divided by drawdown.
Strategy archetypes and typical R:R ranges
The market approach of traders through their selected trading styles determines their risk exposure relative to their achievable profits. Scalping requires traders to focus on minimal price changes which usually amount to 5–15 pips. Scalpers require tight stops to protect against sudden market changes thus they use trading ratios between 1:1 and 1:1.5. The style achieves its highest point through fast execution and high frequency rates instead of using big individual payouts.
The trading ratios for day trading extend from 1:1.5 to 1:2. A trader starts trading EUR/USD at 1.0850 while using a 20-pip stop-loss and aiming for a 35-pip profit. The ratio of 1:1.75 balances reasonable protection with a reward that can be achieved within the same session.
Swing trading enables traders to access bigger trading opportunities because they hold positions throughout multiple days. The most common trading ratio periods for traders are 1:2 and 1:3 because these time frames enable them to see broader price movements. For example, risking 80 pips on GBP/USD to aim for 200 pips reflects the larger movements associated with multi-day trends.
The time frame of position trading which spans weeks to months allows traders to achieve risk-to-reward ratios exceeding 1:4. The investment methods need both time and proper capital management to generate substantial profits when investors track market patterns throughout long periods. The selection of matching strategy depends on the actual R:R ratio which results in consistent results.
Templates and checklists
Standard tools for operational processes enable organizations to perform risk-to-reward ratio assessments with ease. A basic calculator exists as a spreadsheet application or users can access it through MetaTrader. The system requires four basic inputs which include account balance and percentage of equity at risk and stop-loss distance in pips and target distance in pips. The calculator produces position size and pip value and effective risk-to-reward ratio after costs in its output. The maximum pip value for this example would be 2 USD because the account balance stands at 5,000 USD and the risk per trade is 1% (50 USD) and the stop-loss is 25 pips. The trade aims to reach 75 pips which results in a 1:3 risk reward ratio.
Checklists operate as additional resources which help people keep their organizational systems intact. The pre-trade checklist requires traders to check their stop-loss positions and target distances and confirm a minimum risk-reward ratio of 1:2 and track upcoming news events which could affect market price movements. Post-trade journaling holds the same level of worth as pre-trade journaling. The process of recording trade execution against the plan and actual ratio and execution deviations enables continuous improvement of trading strategies.
Conclusion
Risk-to-reward ratio mastery demands methods which extend past the basic steps of target setting and stop-loss implementation. A trader must unite mathematical understanding with strategic thinking and disciplined execution to create a systematic trading method which performs well for every trade. The ratio provides a simple comparison between potential profit and potential loss but its usefulness requires regular use.
The main factor which determines success in sports is discipline. The practice of emotional habits which includes premature cutting of winning trades and moving stop-losses can harm the risk-reward ratios that traders have worked to establish. The use of checklists and calculators and trading journals as tools enables traders to maintain consistency during backtesting and forward-testing which validates strategies before using real capital.